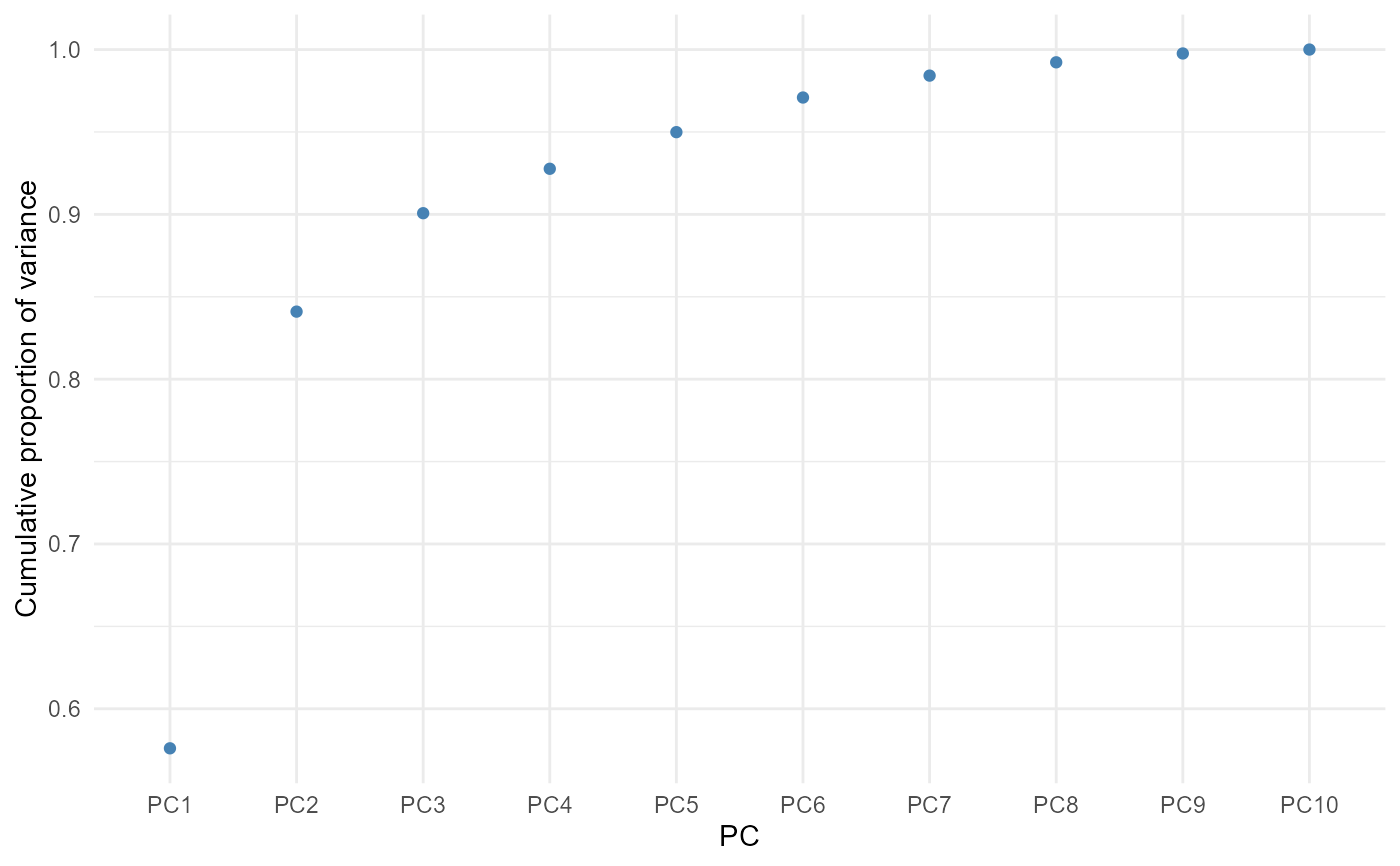
Plots the proportion or cumulative proportion of variance explained by each component (PCA) or factor (EFA).
Usage
plot_mv_scree(x, type = c("prop", "cum"))Examples
r = mv_pca(mtcars, cyl:carb)
plot_mv_scree(r)
#> `geom_line()`: Each group consists of only one observation.
#> ℹ Do you need to adjust the group aesthetic?
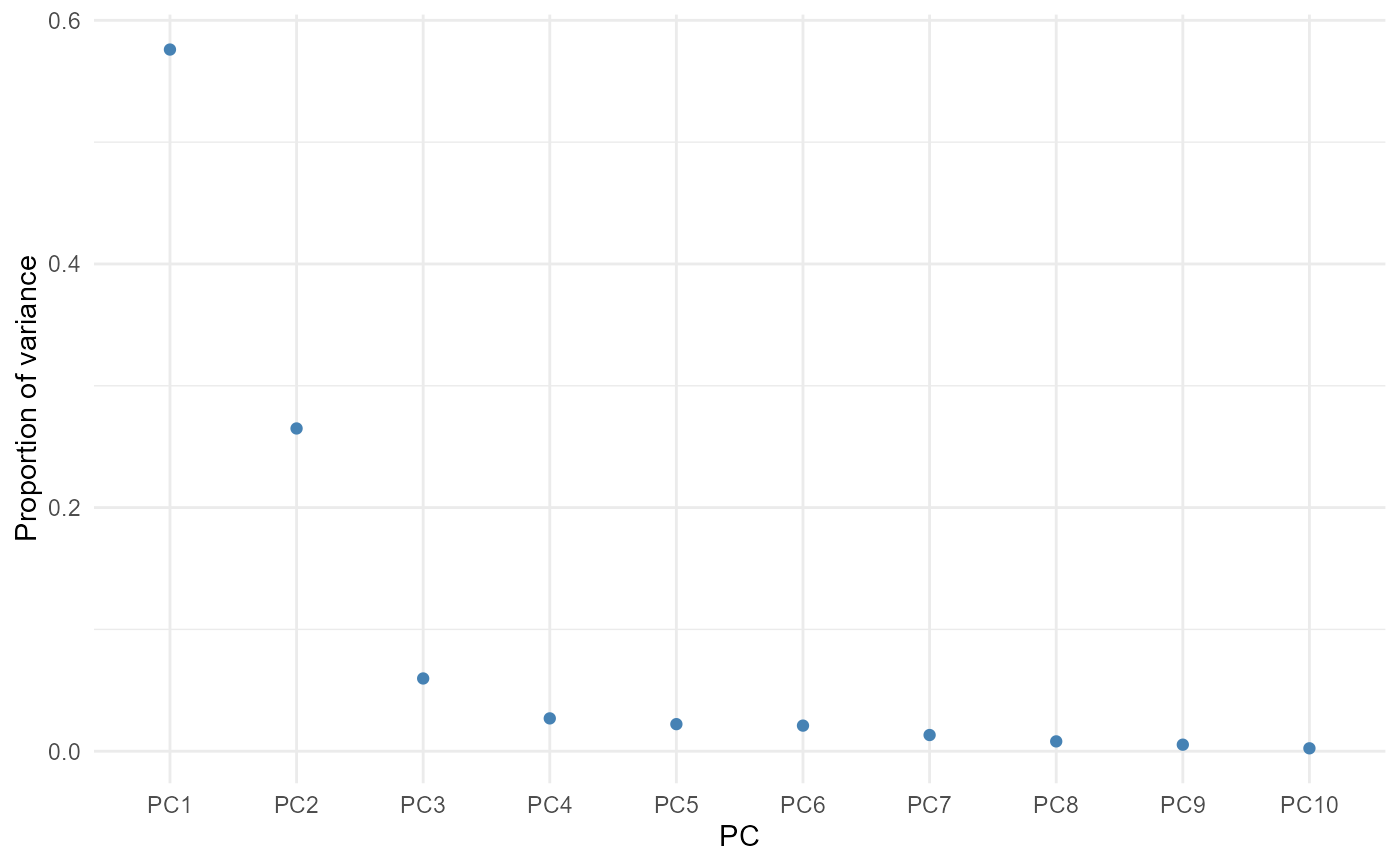 plot_mv_scree(r, type = "cum")
#> `geom_line()`: Each group consists of only one observation.
#> ℹ Do you need to adjust the group aesthetic?
plot_mv_scree(r, type = "cum")
#> `geom_line()`: Each group consists of only one observation.
#> ℹ Do you need to adjust the group aesthetic?