Performs a PCA on selected numeric columns and returns tidy components: observation scores, variable loadings, and the variance decomposition.
Arguments
- data
A data frame.
- cols
<
tidy-select> Numeric columns to analyse.- scale
Logical. If
TRUE(default), columns are standardized to unit variance before decomposition; recommended when indicators use mixed units.- center
Logical. If
TRUE(default), columns are centered.
Value
An object of class mv_pca: a list with components
scores (tibble with .row and PC1...), loadings (tibble with
variable and PC1...), variance (tibble with PC, sdev,
variance, prop_var, cum_var), and meta.
Examples
r = mv_pca(mtcars, cyl:carb)
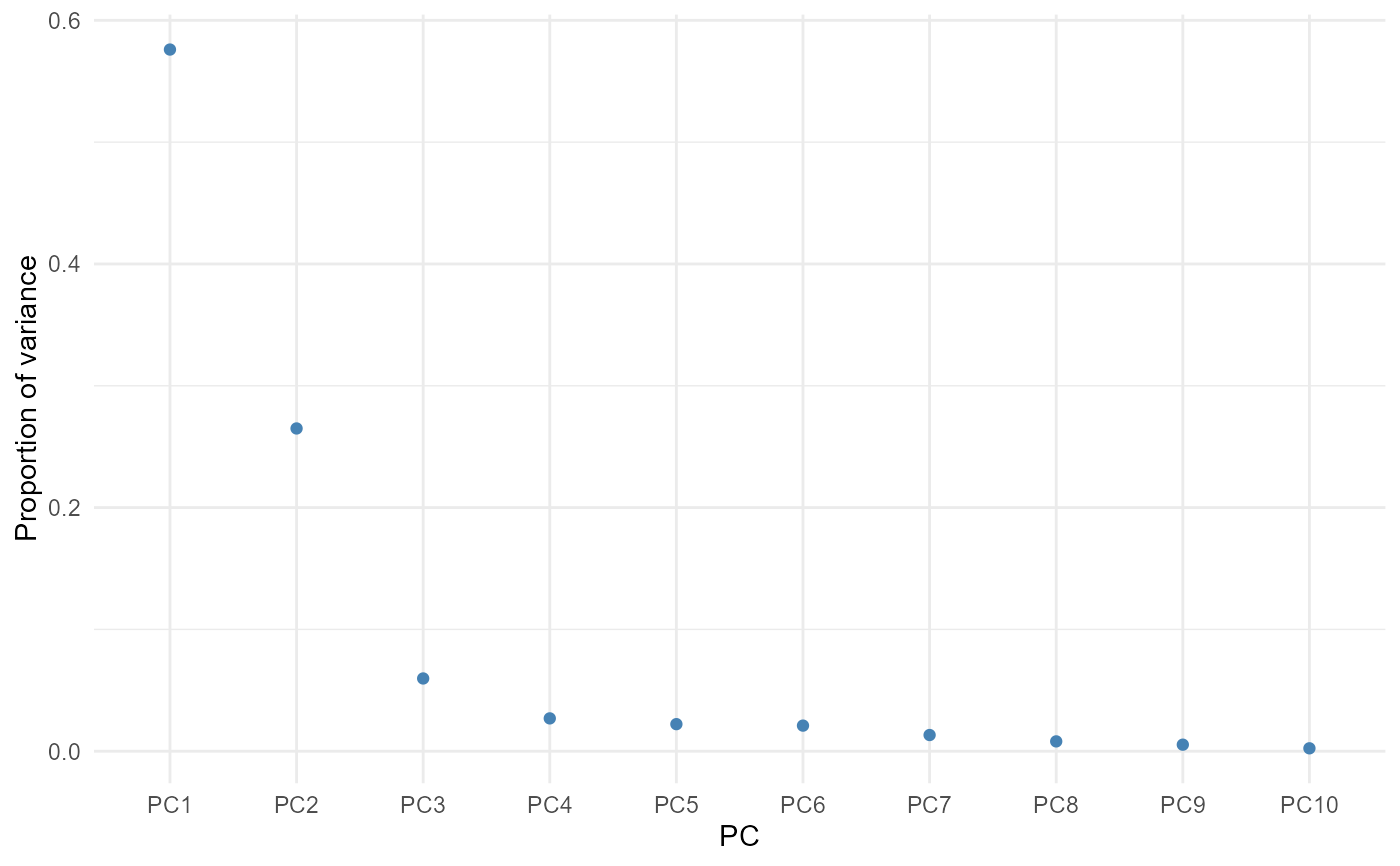
r$variance
#> # A tibble: 10 × 5
#>    PC     sdev variance prop_var cum_var
#>    <chr> <dbl>    <dbl>    <dbl>   <dbl>
#>  1 PC1   2.40    5.76    0.576     0.576
#>  2 PC2   1.63    2.65    0.265     0.841
#>  3 PC3   0.773   0.597   0.0597    0.901
#>  4 PC4   0.519   0.270   0.0270    0.928
#>  5 PC5   0.471   0.222   0.0222    0.950
#>  6 PC6   0.458   0.210   0.0210    0.971
#>  7 PC7   0.365   0.133   0.0133    0.984
#>  8 PC8   0.284   0.0807  0.00807   0.992
#>  9 PC9   0.232   0.0537  0.00537   0.998
#> 10 PC10  0.154   0.0238  0.00238   1
plot_mv_scree(r)
#> `geom_line()`: Each group consists of only one observation.
#> ℹ Do you need to adjust the group aesthetic?