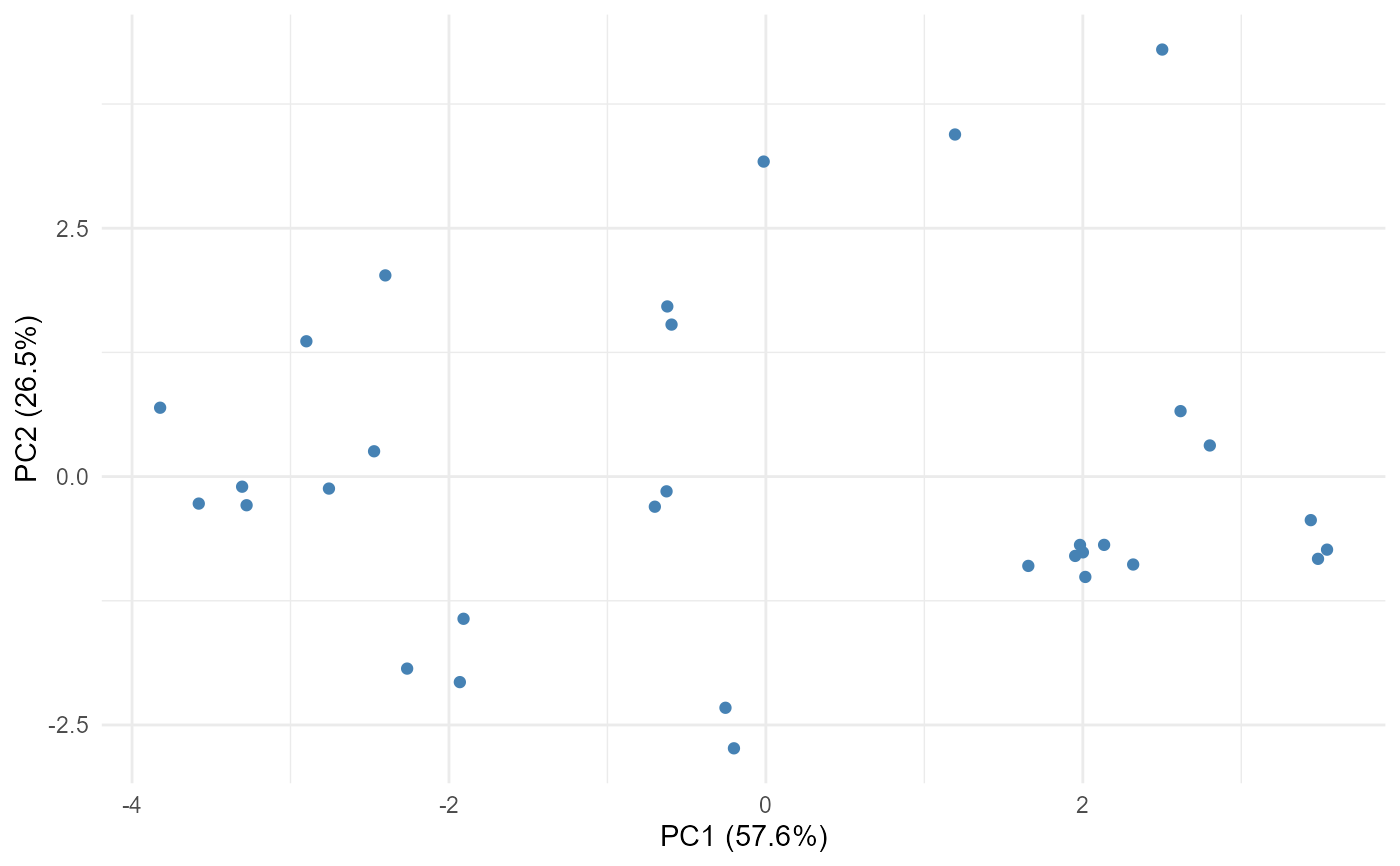
Plots the first two score dimensions of an mv_pca result (PC1 vs PC2) or
an LDA mv_discrim result (LD1 vs LD2), optionally colored by group.
Examples
r = mv_pca(mtcars, cyl:carb)
plot_mv_scores(r)
Plots the first two score dimensions of an mv_pca result (PC1 vs PC2) or
an LDA mv_discrim result (LD1 vs LD2), optionally colored by group.
r = mv_pca(mtcars, cyl:carb)
plot_mv_scores(r)