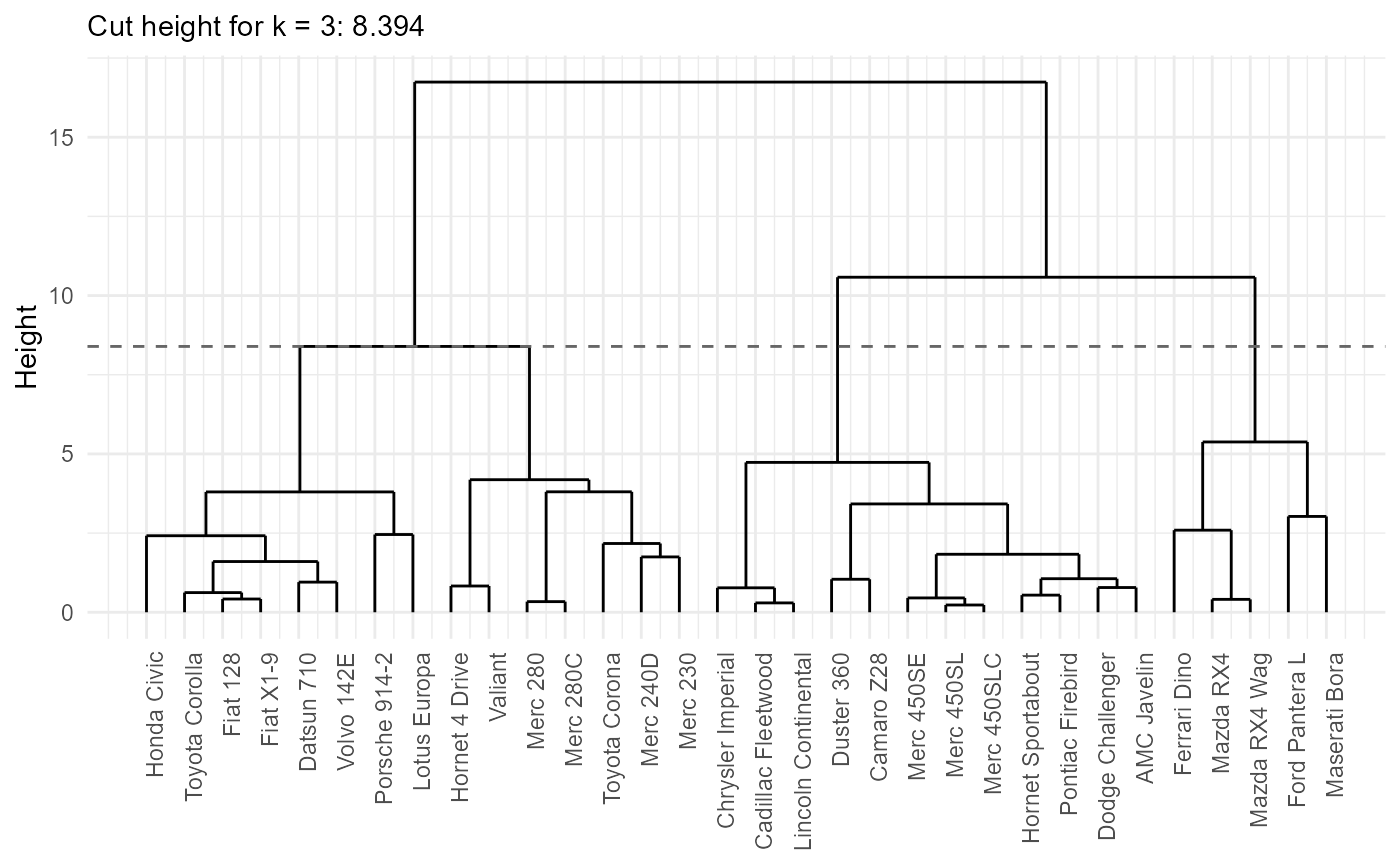
Draws the dendrogram of an mv_hclust result with ggplot2, with a dashed
reference line at the tree height where the k clusters are cut.
Examples
r = mv_hclust(mtcars, cyl:carb, k = 3)
plot_mv_dendrogram(r)
Draws the dendrogram of an mv_hclust result with ggplot2, with a dashed
reference line at the tree height where the k clusters are cut.
r = mv_hclust(mtcars, cyl:carb, k = 3)
plot_mv_dendrogram(r)