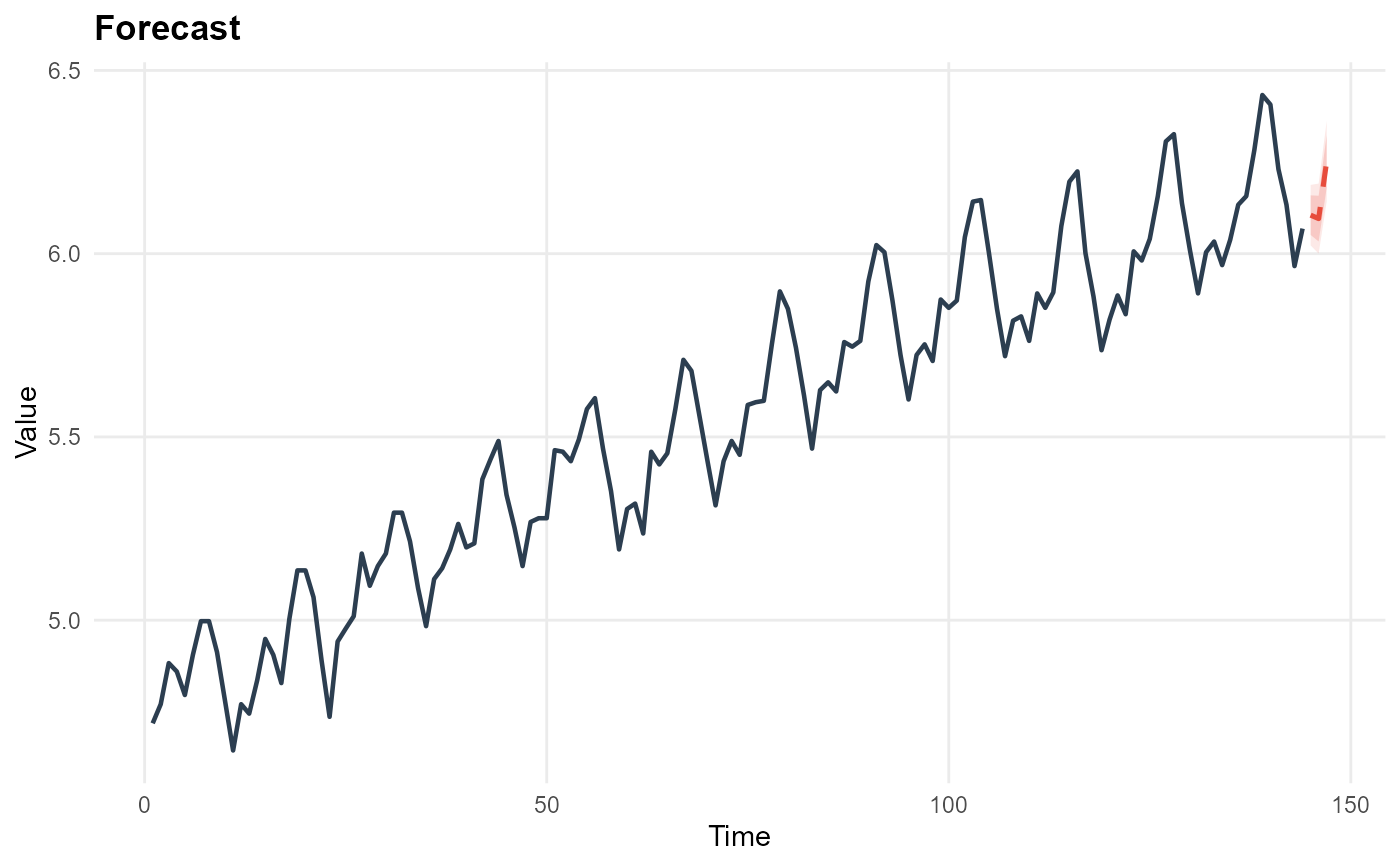
Plot Forecasts
Usage
plot_ts_forecast(
  x,
  forecast_tbl,
  level = c(80, 95),
  by = NULL,
  title = "Forecast"
)
Arguments
- x
Original
ts_df.- forecast_tbl
Result from
ts_forecast().- level
Confidence levels to draw when present.
- by
Step size for future time values.
- title
Plot title.