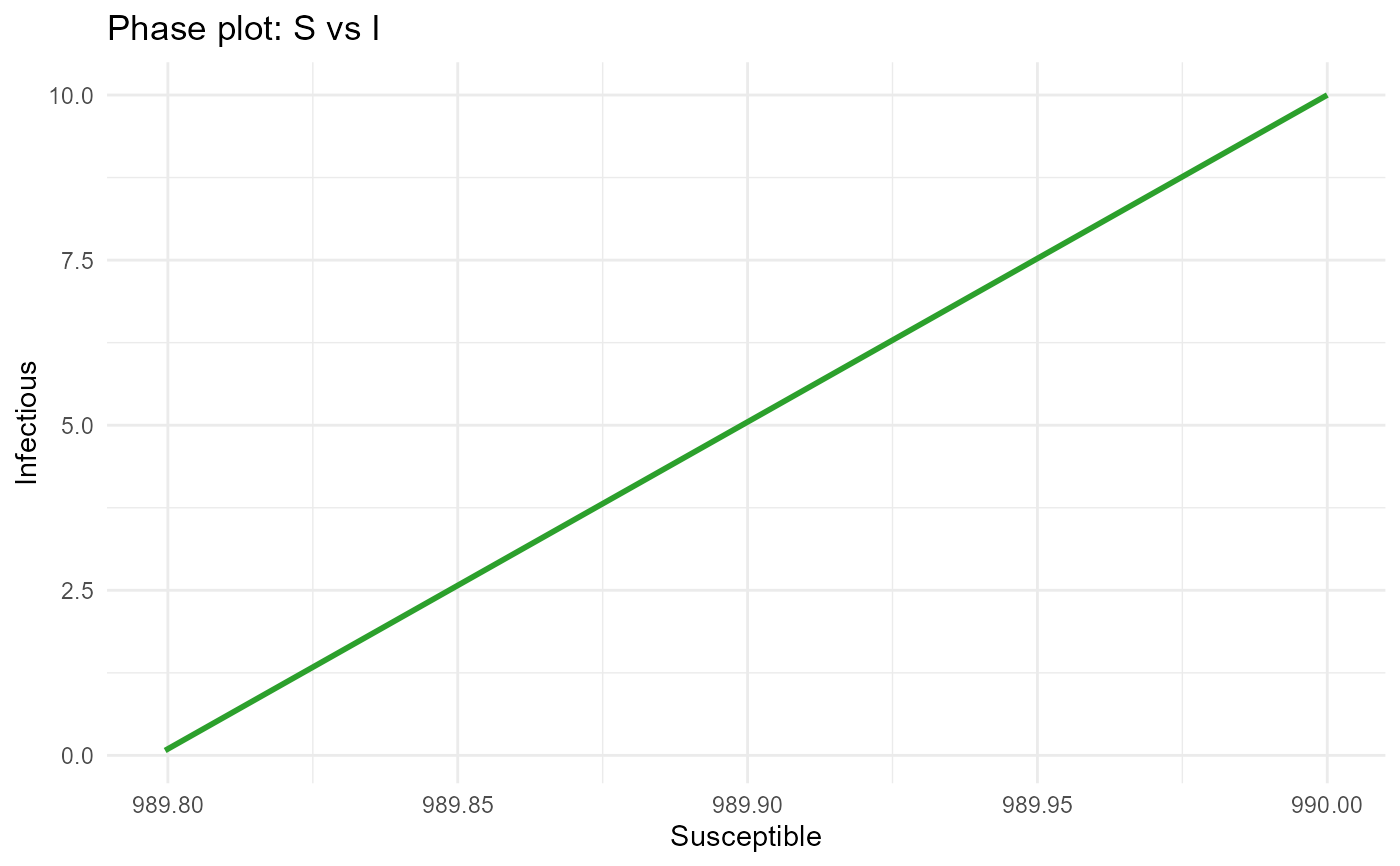
Draws a trajectory in the \((S, I)\) plane. Useful for visualising the epidemic orbit and threshold behaviour.
Value
A ggplot object.
Draws a trajectory in the \((S, I)\) plane. Useful for visualising the epidemic orbit and threshold behaviour.
A ggplot object.