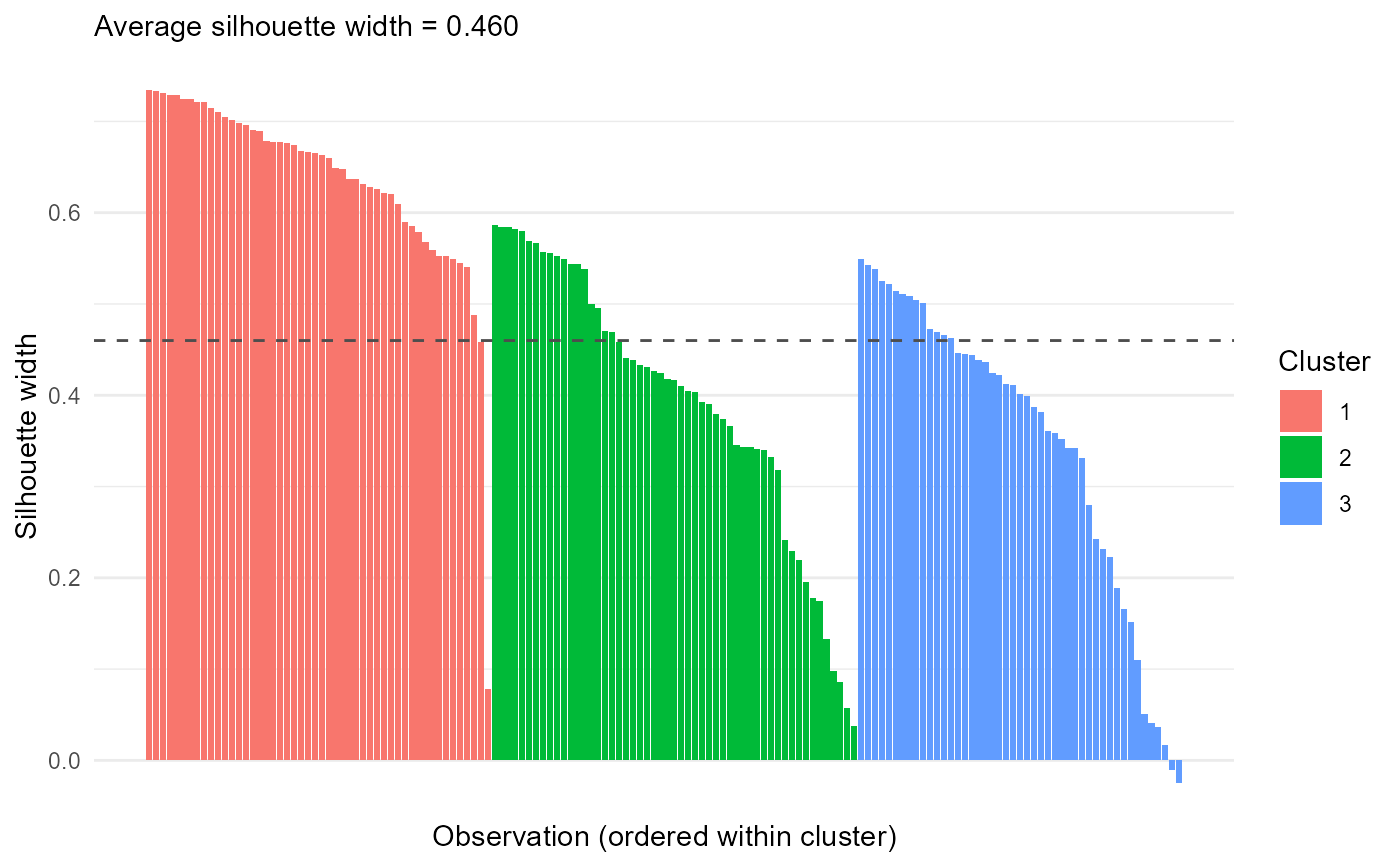
Draws the silhouette plot (per-observation silhouette widths grouped by
cluster, sorted within clusters) with the average width as a reference
line. Accepts an mv_cluster_metrics, mv_kmeans, or mv_hclust result;
for the latter two the widths are computed from the stored analysis matrix,
using the distance method recorded in the result's meta (euclidean for
mv_kmeans, which always clusters in euclidean space).
Examples
km = mv_kmeans(iris, Sepal.Length:Petal.Width, centers = 3)
plot_mv_silhouette(km)