R/mv_stats.R
plot_mv_mds.Rd
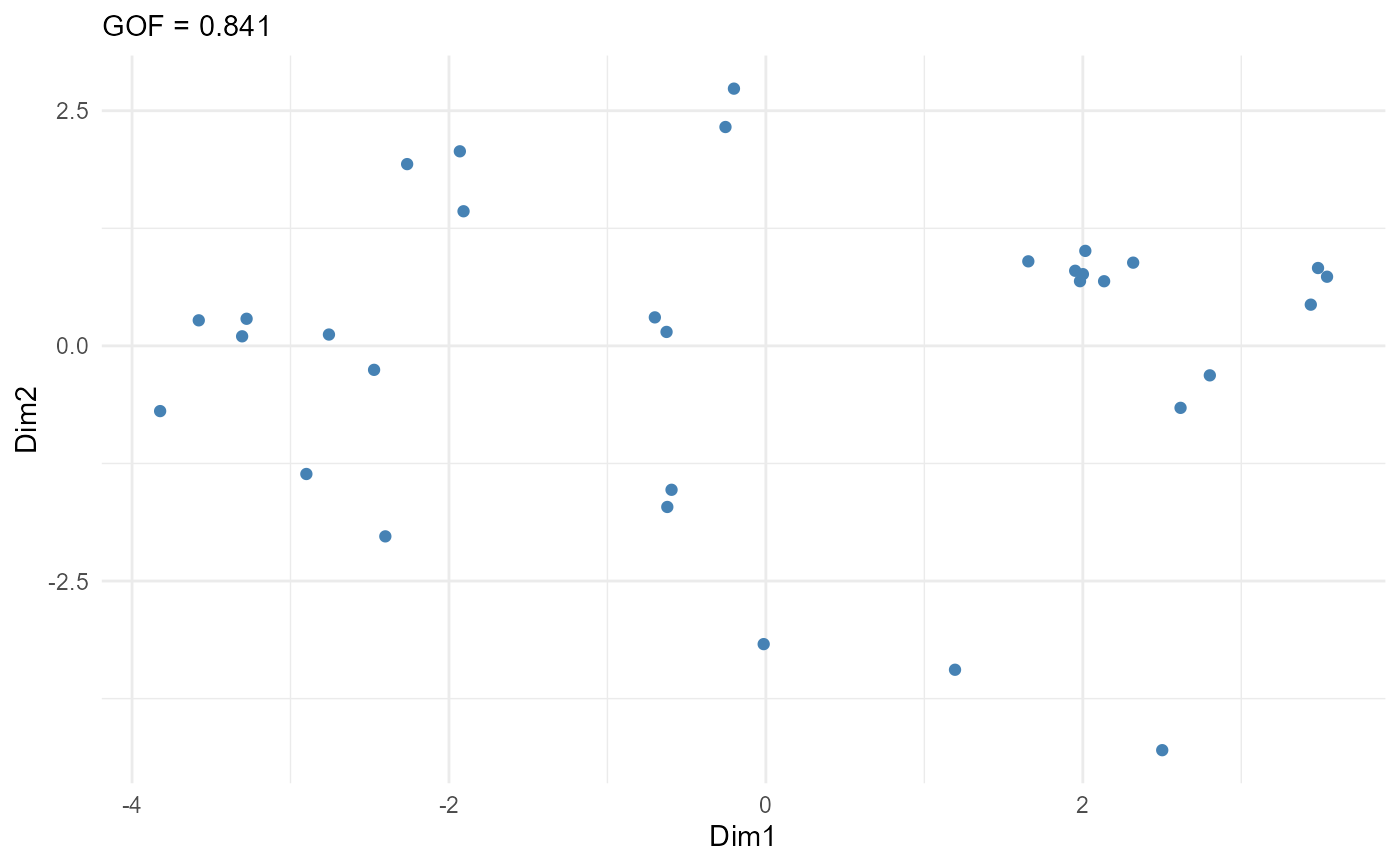
Plots the first two dimensions of an mv_mds configuration.
mv_mds
plot_mv_mds(x)
An mv_mds result with k >= 2.
k >= 2
A ggplot object.
ggplot
r = mv_mds(mtcars, cyl:carb, k = 2)
plot_mv_mds(r)