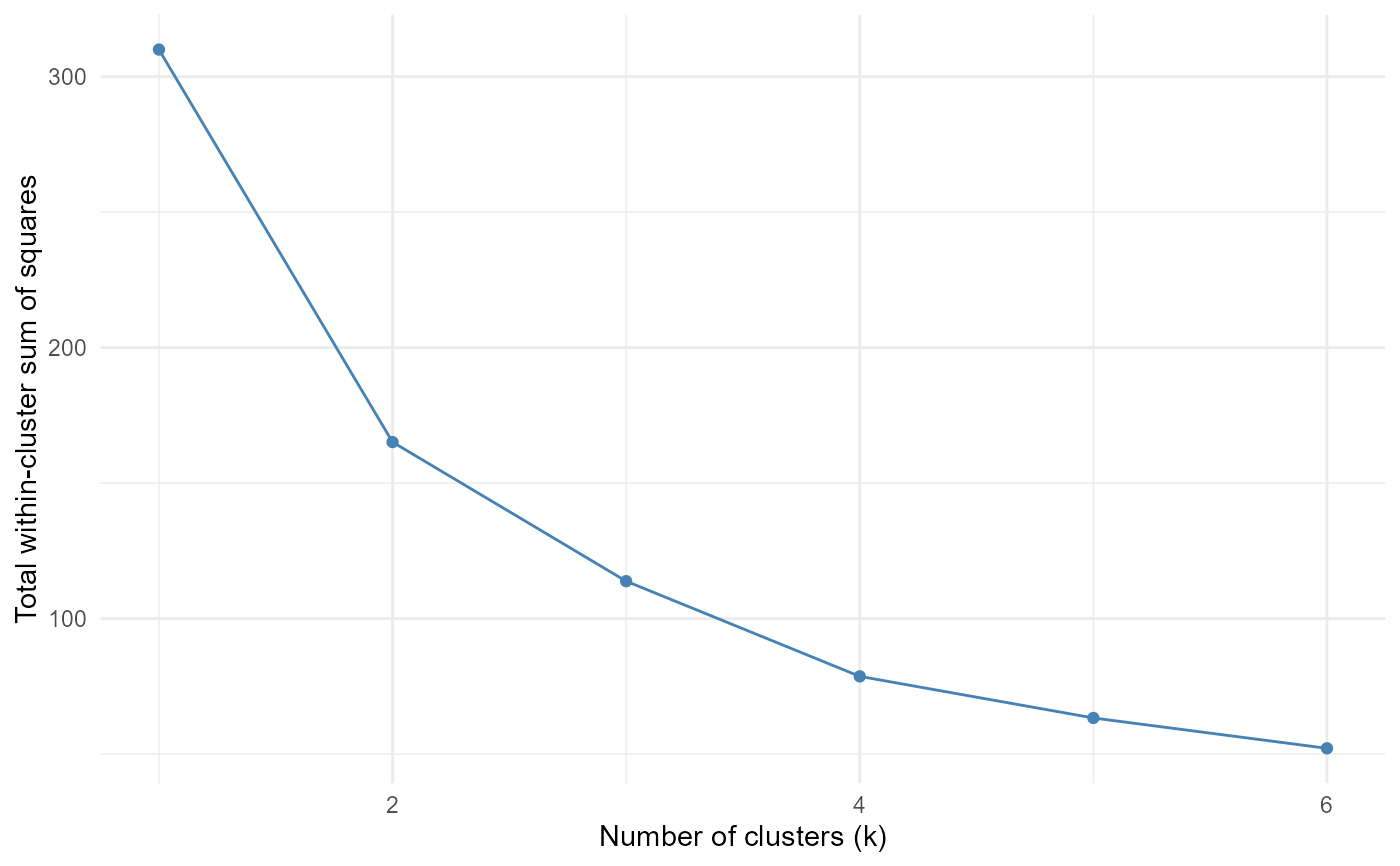
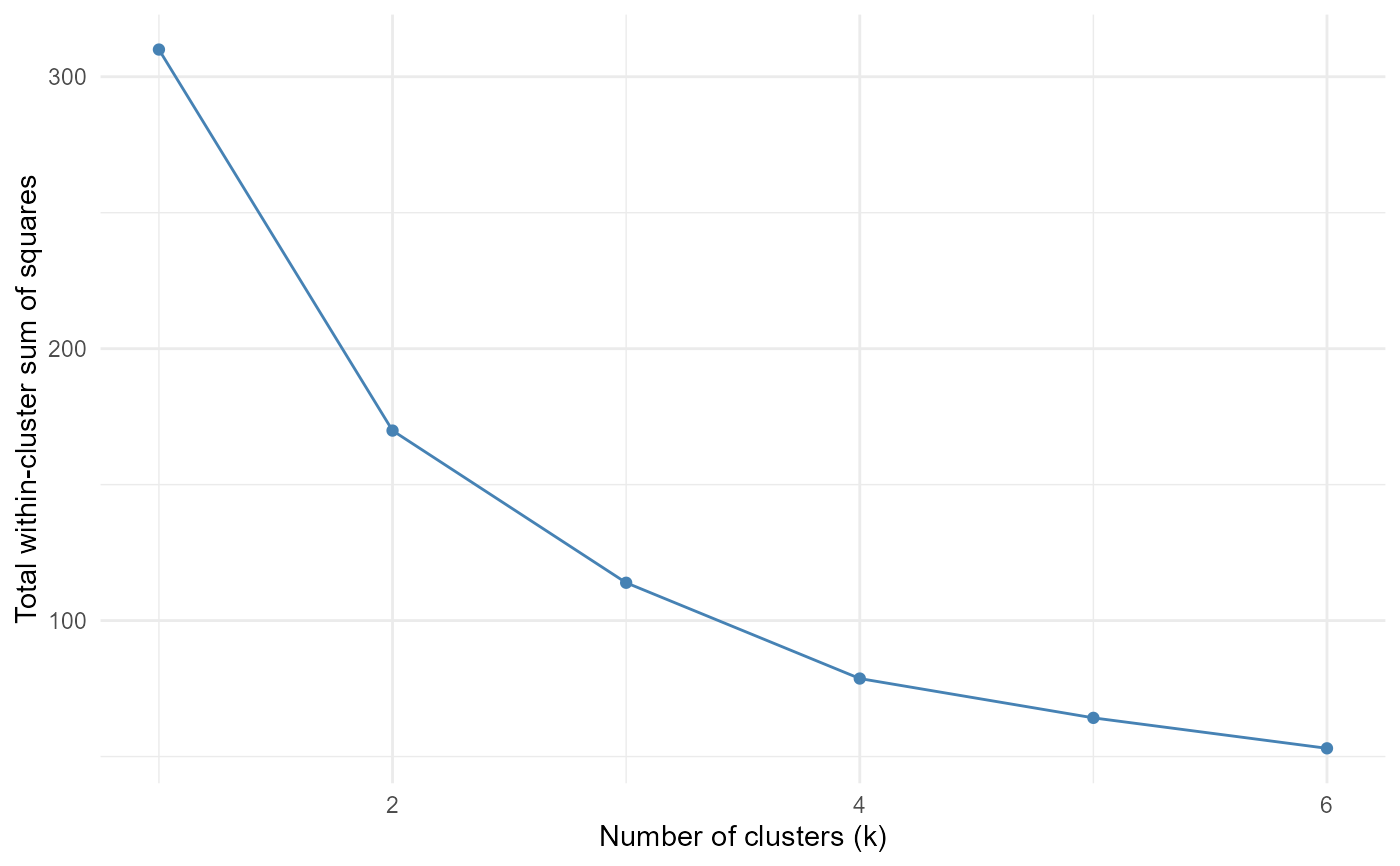
Plots the total within-cluster sum of squares against the number of
clusters k, for k-means (refit per k) or hierarchical clustering
(one tree, cut at each k). The k-means branch fixes the RNG seed
(1234) internally so the curve is reproducible; the caller's RNG state
is restored afterwards.
Usage
plot_mv_elbow(
  data,
  cols,
  max_k = 10,
  method = c("kmeans", "hclust"),
  nstart = 25,
  dist_method = "euclidean",
  hclust_method = "ward.D2",
  scale = TRUE
)
Arguments
- data
A data frame.
- cols
<
tidy-select> Numeric columns to cluster on.- max_k
Largest number of clusters to evaluate.
- method
Either
"kmeans"(default) or"hclust".- nstart
Number of random starts for k-means.
- dist_method
Distance method for the hierarchical tree.
- hclust_method
Agglomeration method for the hierarchical tree.
- scale
Logical. If
TRUE(default), columns are standardized first.