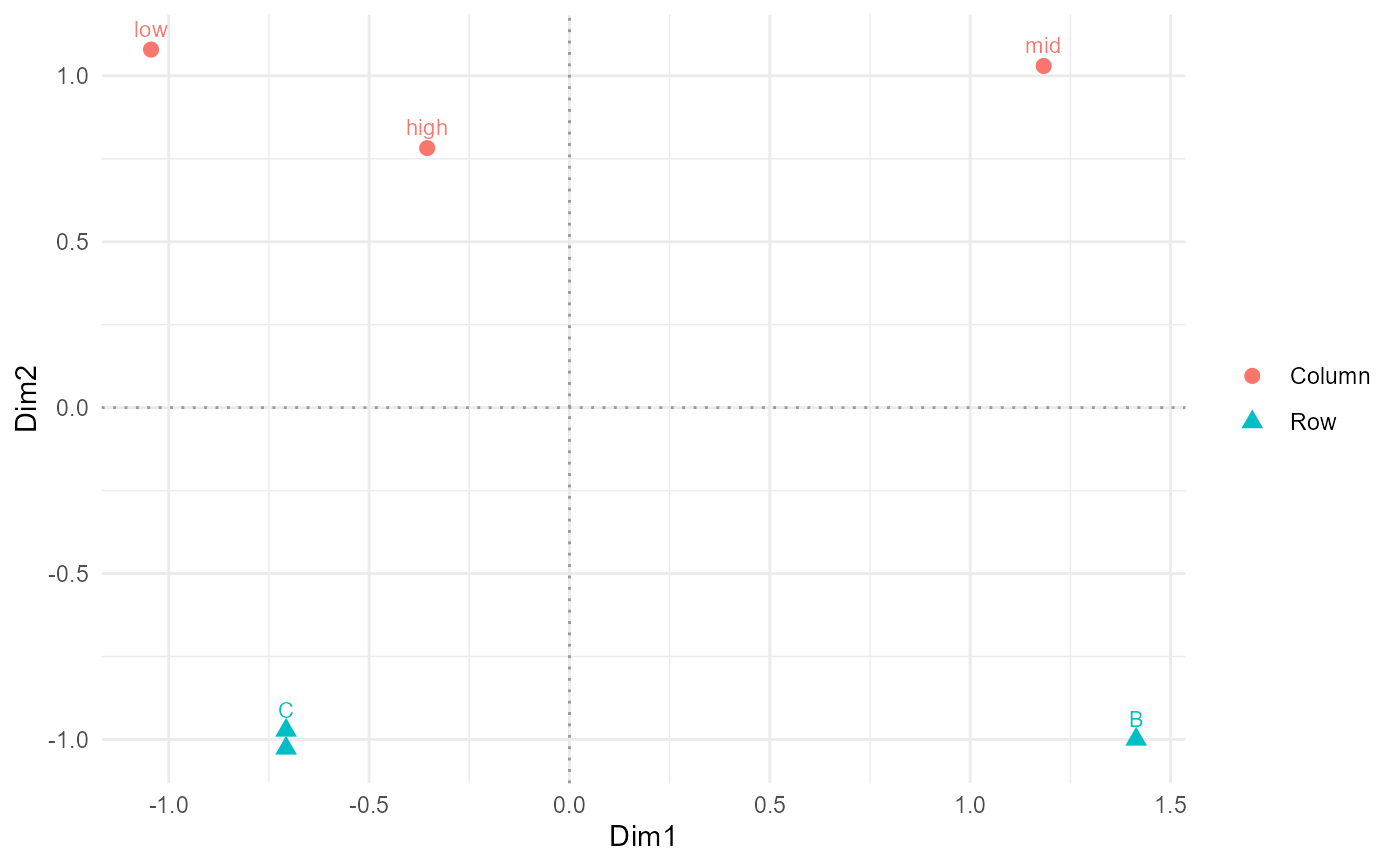
Draws the symmetric two-dimensional map of a mv_corresp result: row and
column coordinates with labels.
Examples
set.seed(42)
df = data.frame(
  breed = rep(c("A", "B", "C"), each = 30),
  grade = sample(c("low", "mid", "high"), 90, TRUE)
)
r = mv_corresp(df, breed, grade)
plot_mv_corresp(r)