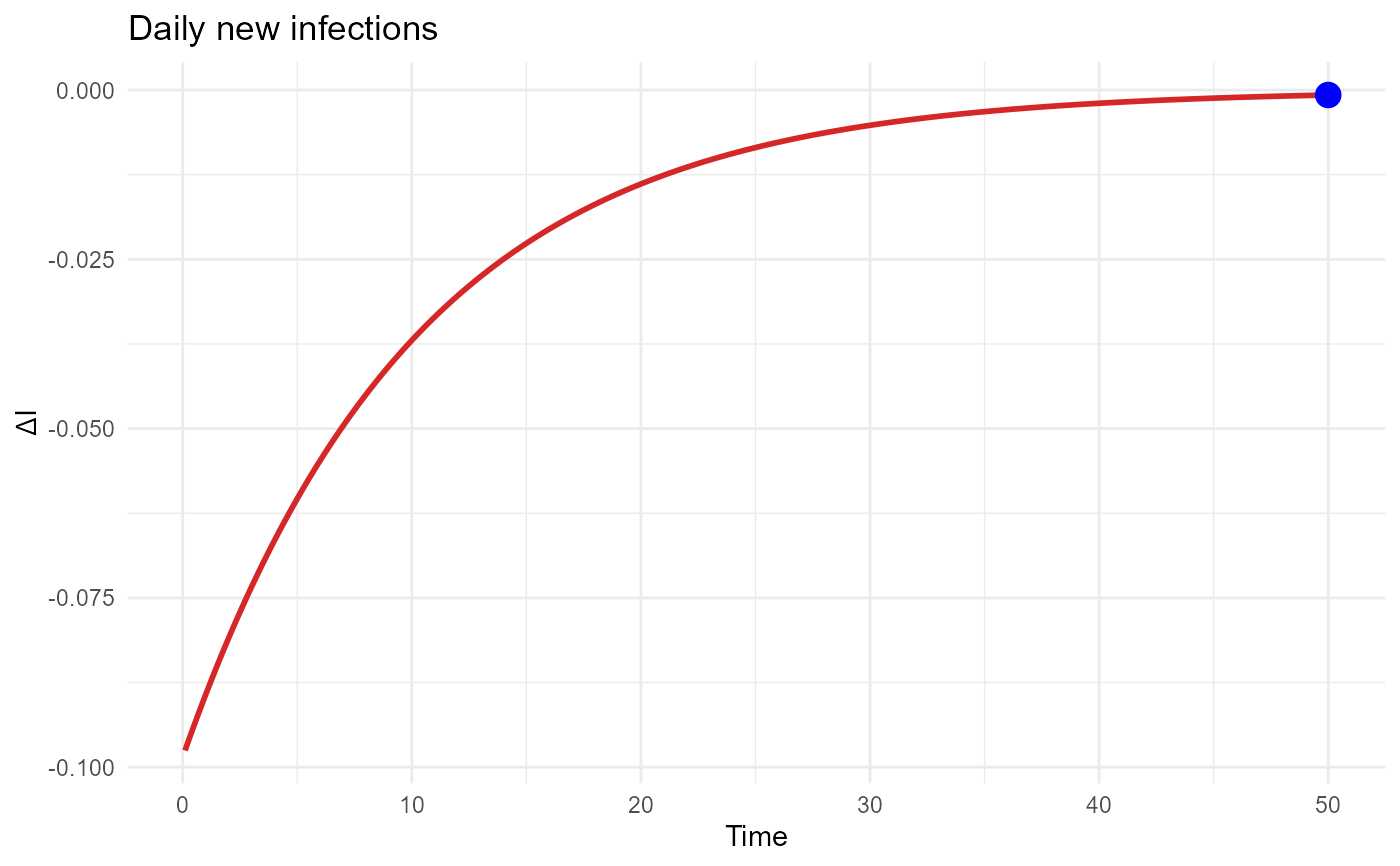
Computes the daily change in the infectious compartment \(\Delta I\)
directly via diff() and plots it as a line chart. The peak is
highlighted with a point marker.
Arguments
- df
A data frame returned by
ode_solver()or any built-in model function. Must contain columnstimeandI.
Value
A ggplot object.