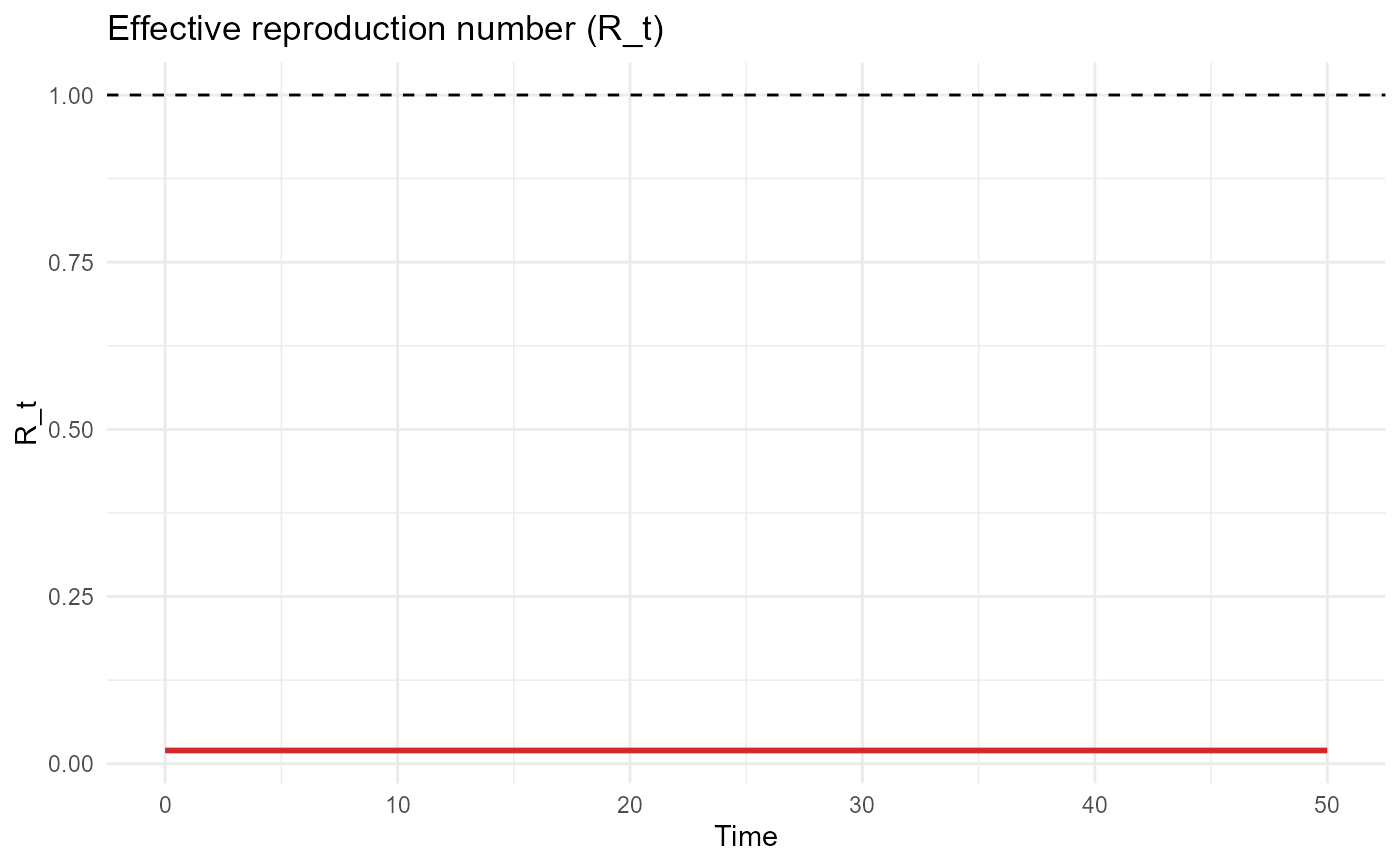
Estimates the time-varying effective reproduction number
\(R_t = \beta S(t) / (\gamma N)\) directly from compartment data
(the standard formula for a frequency-dependent SIR-type model;
equivalently \(R_0 S(t)/N\) with \(R_0 = \beta / \gamma\)).
Usage
plot_Rt_estimate(df, params, N = NULL)
Arguments
- df
A data frame with columns time and S.
- params
A named numeric vector or list containing at least
beta and gamma.
- N
Total population size. If NULL (the default),
it is estimated from the sum of the known state columns (S, E, I, R)
at the first time step.
Value
A ggplot object with a dashed
horizontal line at \(R_t = 1\).
Examples
sir = ode_sir(
  init   = c(S = 990, I = 10),
  params = c(beta = 0.002, gamma = 0.1),
  times  = seq(0, 50, by = 0.1)
)
plot_Rt_estimate(sir, params = c(beta = 0.002, gamma = 0.1))